Salim Furth
Research Fellow, Macroeconomics
Salim is a Research Fellow in Macroeconomics at The Heritage Foundation.
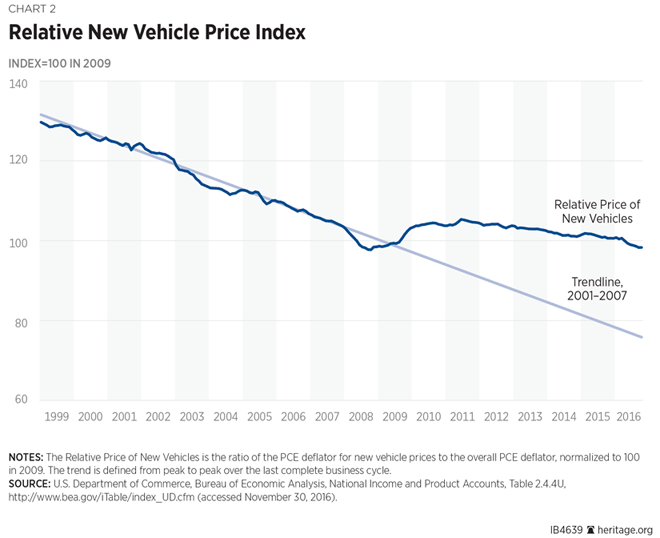
Given that the average new vehicle costs $33,661,[1] the price of a typical vehicle is $7,698 higher than if the pre-recession relative price trend had continued.
The gap between what today’s cars would have cost at the pre-recession trend and actual prices continues to grow. A year earlier, the gap was $7,046; a year before that it was $6,059. Technological progress, which tends to make vehicles cheaper, is not keeping pace with regulation, which makes them more expensive.
EPA’s Misunderstanding of Price Indices
In defending costly new regulations of automobile fuel economy, the Environmental Protection Agency (EPA) dismissed a Heritage Foundation study[2] which argued that the regulations were a cause of the major increase in new vehicle prices since 2009, as other scholars had predicted. However, the EPA’s dismissal of the work was premised on a basic misunderstanding of price indices.The EPA wrote:
These price trends are based on the vehicles that people are buying, not on a constant vehicle model; that is, if people are switching from less expensive to more expensive vehicles, then price trends would increase, even if the prices of individual vehicles had stayed constant.[3]Simply put, the EPA is wrong. The price index trends are based on constant vehicle models and consumers switching between vehicles do not drive price indices. The purpose of a price index is precisely to avoid confusing changes in purchases with changes in prices. Contrary to the EPA’s assertion, if the prices of individual vehicles had stayed constant, the price indices would not have changed.
A price index gives the average of price changes of specific goods, not the average of the prices of all goods purchased.
To be sure, most price indices do adjust to take account of changing consumption patterns. But they do so by shifting the weights assigned to individual price changes, not by comparing unlike goods.[4]
Imagine a market where 100 expensive Maseratis and 100 cheap Fiats are sold in 2016. The price of Maseratis rises 10 percent and the price of Fiats stays constant, causing the market to shift to 80 Maseratis and 120 Fiats in 2017. A price index would show a price increase, due to the higher price of Maseratis, even if the average price paid decreased due to the switch to Fiats.
That an agency tasked with evaluating the costs and benefits of environmental regulation is ill-informed of this fundamental economic concept is both embarrassing and troubling.[5]
Prices Paid Versus Price Indices
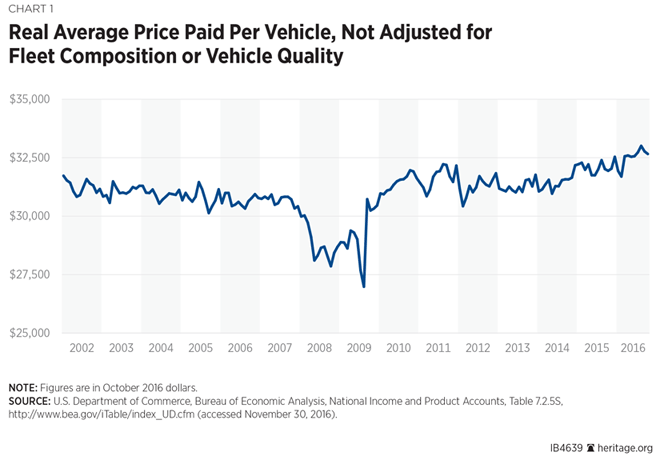
Measuring the average price paid for new vehicles, unadjusted for quality and fleet composition, is straightforward enough. Chart 1 shows the average price paid, adjusted only for economy-wide inflation. This previously unpresented data corresponds to what the EPA thought we used. The Great Recession, when consumers were poorer and demand dropped, stands out: Prices fell suddenly in early 2008. The recovery was more gradual, but was punctuated by a price drop during July and August 2009, when the “cash for clunkers” rebate program was in effect.
If the Heritage Foundation report had based its conclusions on the data in Chart 1, the EPA could have justifiably set the conclusions aside, as those data cannot distinguish between price changes and fleet composition changes. These data also do not reflect the gradual improvement in vehicle quality.
To create the price indices Heritage did use, however, the Bureau of Labor Statistics (BLS) measures the price change for each specific model of vehicle and compares the year-over-year change, explicitly making adjustments intended to take quality changes into account.[6] The BLS (in the case of the Consumer Price Index) or Bureau of Economic Analysis (in the case of the Personal Consumption Expenditures deflator) then uses an inflation formula to average together the price changes for all vehicle models that it measures.
Chart 2, unlike Chart 1, isolates the effects of price changes and tells a story: relative vehicle prices fell steadily before the Great Recession, and then broke away from their previous trend. The gap between the 2001–2007 trend and current price levels has widened to 23 percent. Note how much less this price series reacts to the Great Recession: It only takes changes in price into effect, not changes in demand.

Confirming Predictions
Considered alone, a trend change in the price of vehicles would raise questions, but not provide answers. As those who read the earlier Heritage Foundation paper understand, however, the price trends are evidence confirming three earlier predictions by academic researchers that the cost of the EPA’s fuel-economy standards would vastly exceed the savings on gas.Heritage wrote about those three predictions at length:[7]
Kate Whitefoot, Meredith Fowlie, and Steven Skerlos modeled the ways that car design could respond to the standards in effect for MY [Model Year] 2014. They found that the tightening of the regulations since 2009 would cost consumers an additional $59 billion per year.[8] Projected to MY 2016 and adjusted for inflation, the annual estimated cost to consumers is $82.5 billion.[9]
Thomas Klier and Joshua Linn compared automakers’ reaction to higher fuel standards in the short run (when they can change only prices) and the medium run (when they can change both prices and vehicle design).[10] They find that companies and consumers are worse off on account of the regulations in both scenarios, but the medium-run scenario is worse for consumers. They estimate that a 1 mpg tightening of the standard would cost consumers $7.81 billion annually.[11] Projecting the estimate to match a 9 mpg regulatory change and adjusting for inflation, the cost estimate grows to $61.2 billion per year.
Mark Jacobsen also modeled the CAFE standards increase, distinguishing between different automakers and including the used car market in his model.[12] He found that domestic automakers and consumers would bear almost all the costs of the regulations. Consumers’ losses add up over time as the costs of the new regulations work their way through the used car market. After 10 years’ adjustment, the burden of the regulations will fall most heavily on households with incomes below $25,000.[13] Jacobsen’s estimate of the total consumer cost of a 1 mpg increase in CAFE standards after 5 years is $20.87 billion per year,[14] almost triple the comparable estimate of Klier and Linn. For the 9 mpg regulatory change through MY 2016, adjustments bring the annual consumer cost to $186.1 billion.
In all three papers, the consumer costs are measured as “consumer surplus” or “equivalent variation.” These are important theoretical concepts that fail to translate directly into price changes.[15] Nonetheless, consumer surplus is strongly related to prices, and it is difficult to imagine that the price change could be substantially less than the consumer surplus loss per unit sold.[16] If demand is flexible, however, the price change could be quite a bit higher. All three papers take into account the value of fuel efficiency to consumers, which also tends to make consumer surplus loss per vehicle smaller than the average price change.
In the most modest of the estimates, the consumer surplus loss per new vehicle sale is over $3,800.[17]The contribution of that one Heritage Foundation report to this literature was small, comparing academic predictions to the actual price trends and finding that, allowing for some gas savings, the cost to consumers was in line with the academics’ predictions.
Costs of Regulation
The immediate disagreement between the EPA and its academic critics is the cost of installing fuel-saving technology in new vehicles. If the academics are correct, then the EPA’s sanguine view that ever-stricter regulation will save consumers money[18] is likely to be wrong.The EPA sadly seemed not to engage with those papers, despite having seen the Heritage report. Two of the three key papers on the net consumer cost of the new fuel economy standards are unmentioned in the EPA’s Proposed Determination and Technical Support Document,[19] although the EPA’s two documents run to 968 pages. The third academic paper (Jacobsen’s) is mentioned briefly and only for its treatment of the used-car market.[20] In its latest work, the EPA offers no response to independent estimates of the cost of technology.
Given the potentially very high cost of the fuel economy rules and the uneven quality of scholarship in the Proposed Determination, the EPA should re-visit its review of the Model Year 2022–2025 fuel economy standards with a full treatment of the potential costs of the regulation. Rather than unabashed partisans of regulation, as the present Proposed Determination clearly indicates, the EPA ought to be champions of American citizens, considering the costs and benefits of proposed regulations with equal rigor.

No comments:
Post a Comment