Michael T. Belongia
Peter Ireland

In
December 2015, after keeping its federal funds rate target close to
zero for more than seven years, the Federal Open Market Committee (FOMC)
finally achieved “lift off,” raising the target to a range between 0.25
and 0.50 percent. The Committee maintained that very low range for
nearly all of 2016, waiting until last month before bringing the target
rate up another notch, to its current band between 0.50 and 0.75
percent. Will the Fed raise rates more quickly in 2017? Our own
analysis of monetary conditions suggests that the FOMC would be advised
to continue moving gradually instead.
Minutes from the FOMC’s December 2016 meeting
summarize the reasons for the second rate hike, with direct reference
to the Fed’s dual mandate of maximum employment and stable prices.
The
unemployment rate has fallen to 4.7 percent, a value quite close to
current estimates of the natural rate of unemployment. Most FOMC
members view the natural rate as a threshold beyond which further
reductions in unemployment will exert upward pressure on inflation.
Thus, while inflation itself, measured at 1.4 percent using the Fed’s
preferred price index for consumer expenditures, remains below the
FOMC’s announced target of two percent, low unemployment has
strengthened Committee members’ confidence that inflation will return to
a value much closer to target in 2017. Indeed, projections accompanying the FOMC minutes indicate that several additional interest rate increases can be expected in the year ahead.
Clearly,
the FOMC’s strategy continues to be shaped by the belief that the
Phillips curve relation describes a tight link between unemployment and
inflation – an idea we disputed in a previous column for E21.
The FOMC’s strategy rests importantly, as well, on the idea that
interest rates serve most reliably as indicators of the stance of
monetary policy, with continued low rates signaling that policy remains
exceptionally accommodative. Monetarist economists such as Milton
Friedman often point out, however, that interest rates can provide a
misleading view of the effects that monetary policy is having on the
economy especially when inflationary expectations have become unstable.
Most famously, during the Great Depression, Fed policymakers mistakenly
took very low interest rates to mean that they were doing all they
could to support an economic recovery. But a sharp contraction in
measures of money showed, more correctly, that monetary policy was
excessively tight, exacerbating rather than ameliorating the economic
downturn.
Our own recent research
outlines an alternative approach that uses the quantity theory and
measures of money to gauge the stance of monetary policy, which we
propose as a cross-check against more popular analyses built on the
Phillips curve and interest rates instead. Our empirical framework is
organized around two observable variables: the Divisia MZM money supply
as the measure of M on the left-hand side of the quantity equation MV =
PY and nominal GDP as the measure of PY on the right. Because nominal
income is, by definition, the product of real GDP (Y) and the aggregate
price level (P), it conveniently summarizes in one variable both sides
of the dual mandate: maximizing output or employment and stabilizing
prices.
Since
2011, Divisia MZM has grown at an annual rate between 6 and 7 percent,
while nominal GDP has expanded by only 3.5 to 4 percent per year. This
comparison reveals that, instead of remaining constant as the simplest
version of the quantity theory assumes, monetary velocity V has trended
slowly downward over this period. Our approach tracks these changes in V
to estimate, in real time, the long-run value V* towards which actual
velocity appears to be gravitating. We use this estimate of V*,
together with the data on Divisia MZM, to compute the target Q* = MV*
towards which nominal income itself will converge. When the gap between
Q* and PY is positive, it indicates that past money growth is putting
upward pressure on PY; accelerating nominal income growth will then
close the gap. Conversely, when Q* is below PY, past monetary restraint
is putting downward pressure on nominal income. The figure below plots
this “nominal income gap” since 2000.
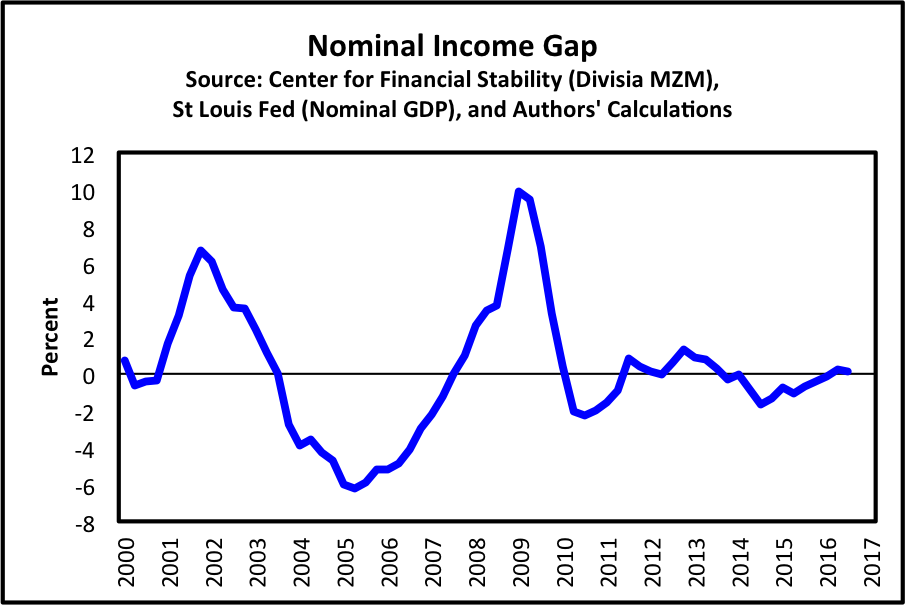 |
By
our measure, monetary policy went from accommodative following the 2001
recession to highly contractionary before the financial crisis of
2007-08. And while policy was appropriately expansionary during the
crisis and recession that followed, its stance since 2010 appears
approximately neutral. This observation leads us to believe that
nominal GDP growth is unlikely to accelerate markedly in 2017. Assuming
that FOMC members are content with nominal GDP growth between 3.5 and 4
percent – which, when split evenly, implies rates of real GDP growth
and inflation between 1.75 and 2 percent – monetary policy seems
well-balanced now. If, however, the FOMC follows through with its plans
to raise interest rates further this year, our monetary cross-check may
provide early warning that they are moving too fast.
No comments:
Post a Comment